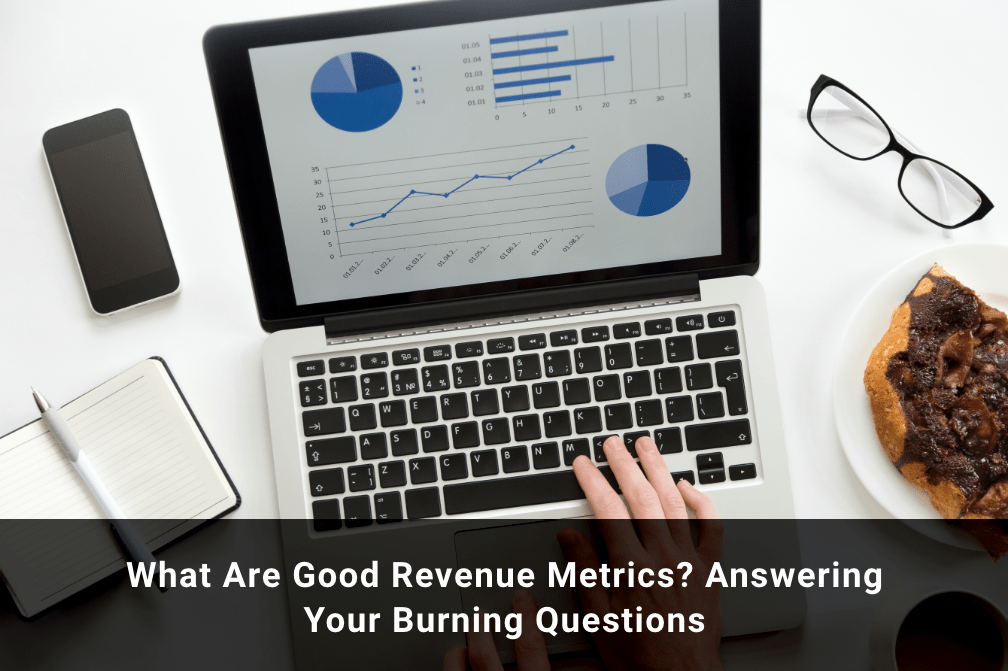
What Are Good Revenue Metrics? Answering Your Burning Questions
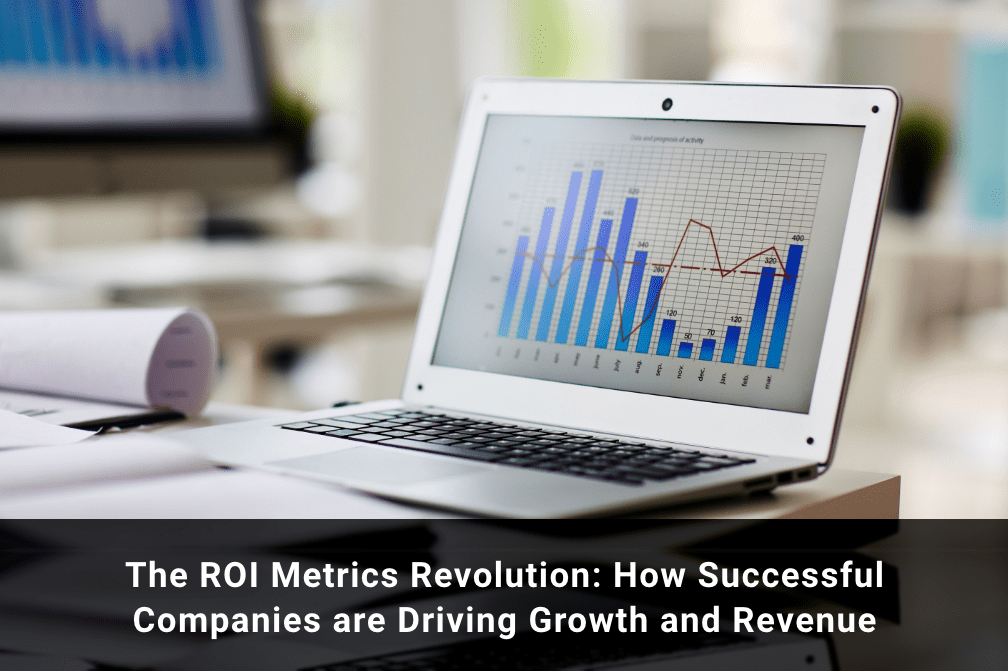
Did you know that B2B companies with excellent revenue metrics outperform competitors in terms of growth? Why? This is due to the fact that revenue indicators are crucial for determining and enhancing B2B marketing performance.
But what precisely are revenue metrics, and how can companies utilize them to spur growth?
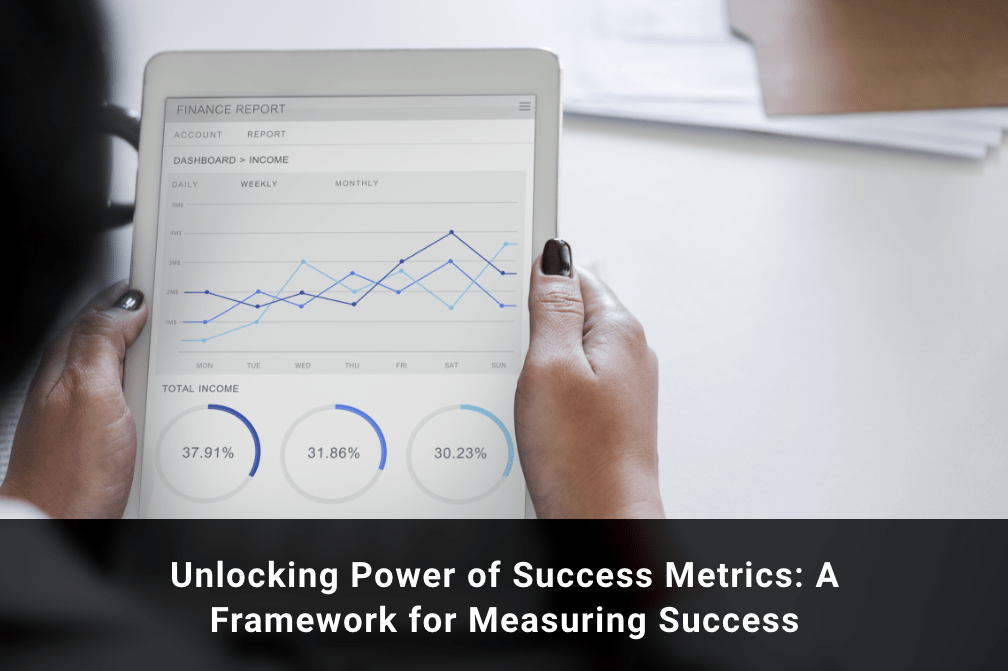
Simply, revenue metrics are key performance indicators (KPIs) that assess the volume and composition of a company's revenue. Similar to the gauges on a car dashboard, revenue metrics provide you with real-time information about how your company is performing. You can see patterns, make informed decisions, and maximize the effectiveness of your marketing campaign by monitoring these indicators.
Depending on their objectives and plans, firms might utilize a variety of revenue measures. client lifetime value (CLV), which calculates the total income a client is anticipated to produce over the length of their engagement with a company, is one crucial indicator. The percentage of website visitors who complete a desired activity, such as completing a purchase or filling out a lead form, is tracked by the conversion rate, which is another important indicator. Another crucial indicator is revenue per customer, which can be used by firms to identify and target their most valued clients.
Choosing the appropriate income KPIs is only half the challenge, though. Effective utilization of these indicators by businesses is also necessary to promote growth. That entails establishing reasonable objectives, examining data to find trends and opportunities, and continuously evaluating and improving marketing tactics.
We have beefed up everything you need to know about revenue metrics. We'll talk about what they are, why they're important, and how you can utilize them to grow your B2B company. Fasten your seatbelt on, and let's start!
Sales Metrics: Unlocking the Secrets to Boosting Your Revenue
As a B2B marketer, you are aware of how important revenue growth is to the success of your company. The most efficient method to achieve this is through monitoring and utilizing sales metrics. Key performance indicators (KPIs) for sales can help you assess the efficiency of your sales process, pinpoint areas for development, and increase revenue.
Definition of Sales Metrics
Sales metrics are numerical measurements that track the performance of your sales force and give you information about how well your sales process is working. These indicators can assist you in comprehending the sales funnel and locating opportunities to improve your sales procedure and increase income. Common sales measurements include, for instance:
As a B2B marketer, you are aware of how important revenue growth is to the success of your company. The most efficient method to achieve this is through monitoring and utilizing sales metrics. Key performance indicators (KPIs) for sales can help you assess the efficiency of your sales process, pinpoint areas for development, and increase revenue. Common sales measurements include, for instance:
Sales Revenue: This indicator represents the overall money earned by the sales force during a certain time period, taking into account all product lines, services, and contracts offered.
Sales Growth: The percentage increase in sales revenue over a certain time period is measured by sales growth. This indicator is crucial for assessing the success of sales initiatives and pinpointing areas in need of development.
Sales Conversion Rate: The percentage of leads that become paying clients is known as the sales conversion rate. This indicator assesses how successfully the sales process converts prospects into clients.
Average Deal Size: This metric gauges the typical value of a transaction. This measure can be used to estimate revenue growth and evaluate how well the sales staff closes transactions.
Sales Cycle Length: This statistic reveals how long it takes for a lead to convert into a paying client. This statistic is crucial for finding sales process bottlenecks and boosting the effectiveness of the sales force.
Lead-to-Opportunity Ratio: This metric calculates the proportion of leads that result in opportunities. This measure can be used to gauge how well the lead-generating procedure is working and to pinpoint areas that need improvement.
Benefits of Tracking Sales Metrics
You can better understand your sales process and find opportunities for improvement by tracking sales analytics. You can locate bottlenecks in your sales process and improve your strategy to promote revenue growth by examining your sales analytics. The following are some advantages of monitoring sales metrics:
- Better Understanding Of The Sales Process
Sales metrics give a complete picture of the sales process and can show where the company is doing well and where it needs to do better. Businesses can spot areas that need improvement and attention by comprehending the sales funnel and monitoring key performance indicators (KPIs) like lead conversion rates, win/loss ratios, and average deal size.
- Identification of Bottlenecks
Sales analytics can assist companies in identifying bottlenecks in their sales process. For instance, if the conversion rate is poor, it can be a sign that the sales presentation or the quality of the leads is an issue. Businesses can take action to remove these bottlenecks and enhance their sales process by recognizing them.
- Finding Opportunities For Development
By keeping an eye on sales analytics, firms can identify issues that their sales staff is having and adjust their approach as necessary. For instance, the company might need to spend money on sales training or modify its sales process if the sales staff is having trouble closing agreements.
- Increased Sales And Marketing Coordination
Businesses can improve their sales and marketing coordination by using sales analytics. Businesses can better understand their target audience and create more successful campaigns by evaluating data from both departments.
- Enhanced Forecasting
Sales data might offer information about a company's potential future success. Businesses are able to forecast future sales income and make plans for it by examining sales data and patterns. This can assist companies in making defensible choices on resource allocation, expansion, and investment.
- Improved Revenue Growth
Businesses can increase their revenue growth by monitoring sales KPIs. Businesses can boost sales revenue and enhance overall revenue growth by locating and removing bottlenecks in the sales process and creating a stronger sales strategy.
From Cycle Time to Revenue Growth: Metrics That Matter
Monitoring sales KPIs is merely the first step toward increasing revenue. Other important revenue indicators might give you important information about the effectiveness and profitability of your company. Cycle time metrics and revenue growth metrics are two crucial variables to take into account.
Cycle time measurements measure the amount of time needed to execute an activity or process from beginning to end. You can spot inefficiencies and bottlenecks in your company's operations by monitoring cycle time measurements. This will enable you to make the required adjustments to increase overall efficiency.
Cycle time measures include, for instance:
- The period of time needed to complete an order from the time it is placed to the time it is delivered is known as the order fulfillment cycle time.
- The length of time it takes to create a thing from beginning to end.
- The length of time it takes a salesperson to conclude a contract with a client is known as the sales cycle time.
- On the other hand, measurements for revenue growth track changes in revenue over a predetermined time frame. These indicators can provide light on how well your company's sales and marketing initiatives are working.
Examples of Revenue Growth Metrics
Monthly Recurring Revenue (MRR)
MRR quantifies the monthly revenue a business receives through recurring agreements or subscriptions. Software-as-a-Service (SaaS) organizations frequently use this measure to monitor the effectiveness of their subscription-based business model. Companies can analyze MRR to see if their recurring revenue streams are expanding or contracting, and then alter their pricing or client acquisition methods as necessary.
Revenue Growth Year Over Year
This indicator calculates the revenue change from the previous year as a percentage. A frequent measure of a company's financial health and capacity to produce steady revenue over time is a year-to-year revenue increase. This indicator is especially helpful for evaluating a company's success in times of economic expansion or contraction.
Gross Revenue
The entire income that a business makes before any deductions, such as costs or taxes, is known as gross revenue. Understanding the scope and extent of a company's revenue sources depends on this measure. Businesses can determine which goods or services are generating the most money by tracking gross revenue, and they can use this information to plan future investments and growth initiatives.
Cycle time and revenue growth indicators can help you better understand your company's operations and pinpoint opportunities for development. You might need to improve your production processes, for instance, if your manufacturing cycle time is too long, in order to boost productivity and cut expenses. You might need to reconsider your pricing plan or step up your client retention efforts if your MRR is dropping.
Revenue Metrics for Specific Industries: What You Need to Know
SaaS Businesses
A crucial indicator to monitor for Software as a Service (SaaS) businesses is monthly recurring revenue (MRR). This statistic calculates the total monthly revenue from all recurring subscriptions. client lifetime value (CLTV), which calculates the entire amount of money a client will bring in over their engagement with your business, is another crucial statistic.
Hotels
Revenue per available room (RevPAR) is a widely used statistic in the hotel sector. According to this statistic, which accounts for both occupancy rates and average room prices, each available room generates a certain amount of money overall. Average daily rate (ADR) and occupancy rate are two more vital indicators for hotels.
Mobile Applications
User retention is a crucial measure to monitor for businesses in the mobile app sector. This indicator counts the proportion of users who use your app consistently over time. Other crucial indicators include lifetime value (LTV), which calculates the overall worth of each user over the length of their engagement with your app, and cost per acquisition (CPA), which calculates the expense of obtaining each new user.
E-commerce
Conversion rate is an important indicator to monitor for businesses in the e-commerce sector. This indicator counts the proportion of website visitors who buy anything. Another crucial indicator is the average order value (AOV), which calculates the typical value of each transaction.
You can acquire a better knowledge of your company's performance and pinpoint opportunities for development by monitoring these revenue measures that are relevant to your sector. To raise occupancy rates, you might need to change your pricing strategy or marketing initiatives if, for instance, your hotel's RevPAR is below the industry standard. Additionally, you can pinpoint your strong points and use that information to set your company apart from competitors by measuring your performance against industry norms.
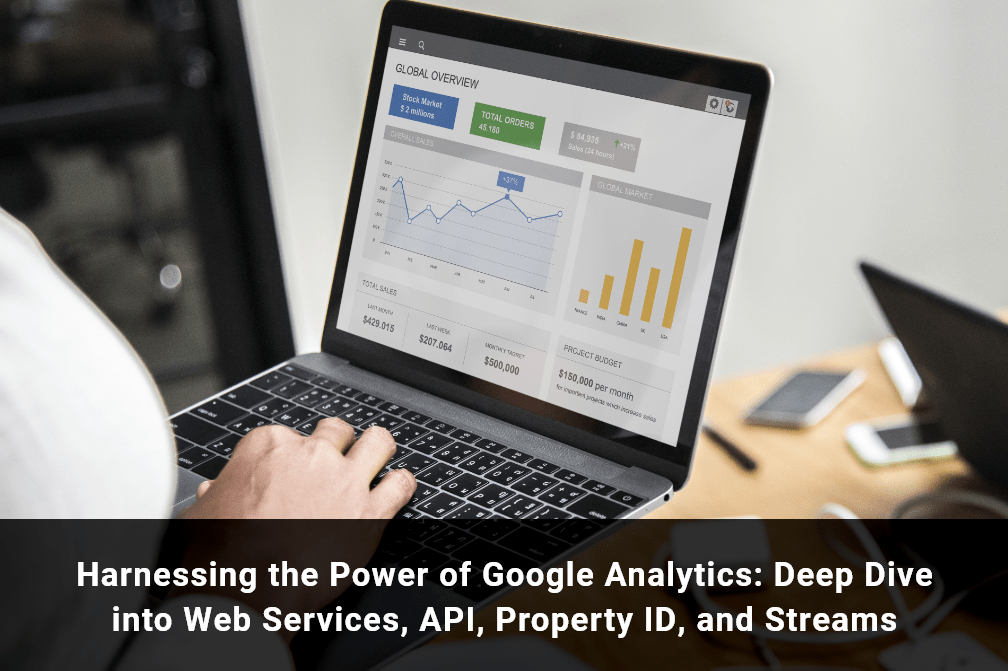
Analytics Tools for Revenue Metrics: Maximizing Your Data
Utilizing analytics tools to monitor and examine revenue indicators is more crucial than ever in the data-driven world of today. Insights into consumer activity are made possible by tools like Adobe Analytics, Google Analytics, and GA 4, and these insights can be leveraged to maximize revenue growth.
Adobe Analytics
You can monitor a variety of revenue indicators with Adobe Analytics, such as revenue per visit, revenue per customer, and average order value. Additionally, the application offers a number of reports that can be utilized to examine income trends and pinpoint areas for development.
Set Up Conversion Tracking: Set up conversion monitoring to monitor user behavior on your website and identify the activities that result in conversions. You can figure out which pages and actions are boosting sales by setting up conversion tracking.
Utilize Segmentation: Adobe Analytics enables you to divide your data into subsets based on characteristics like geography, device type, and user activity. You can find patterns and trends in your data through segmentation, which can then be used to improve your revenue growth strategy.
Use the Pathing Tool: Adobe Analytics' Pathing function lets you see the routes visitors travel around your website. You can determine which routes generate the most income by examining this data, and you can then modify your website appropriately.
Google Analytics
Tracking revenue metrics is possible using Google Analytics, another effective analytics tool. You can track revenue by source, assess the effectiveness of your marketing initiatives, and examine website visitor behavior with Google Analytics. Additionally, the application gives a number of reports that can be utilized to pinpoint problem areas and maximize income development.
Set Up E-Commerce Tracking: Set up e-commerce monitoring so you can monitor sales, transactions, and other important information on your website. You can have a thorough insight into how your website is generating revenue growth by setting up e-commerce tracking.
Utilize Goal Monitoring: Goal tracking enables you to monitor particular website behaviors that increase revenue. You can monitor the success of your marketing initiatives and tweak them for the greatest possible increase in income by defining targets.
Use the Behavior Flow Feature: Google Analytics' Behavior Flow feature lets you see how visitors move throughout your website. You can find parts of your website that can be frustrating for users and optimize them for optimum revenue development by studying this data.
Google Analytics 4 (GA4)
Google's analytics software is now using version 4, which is the most recent version. One of GA4's primary characteristics is its capacity to monitor user activity on a variety of platforms and devices, including websites, mobile applications, and even smart gadgets. Businesses are given a more thorough understanding of the client journeys as a result, enabling them to spot and take advantage of income possibilities at every touchpoint.
Utilize Predictive Analytics: Using past data, GA4's predictive analytics tool enables you to project future revenue growth. By implementing this capability, you can improve your marketing efforts and stimulate revenue development by making data-driven decisions.
Use the Behavior Flow Feature: GA4's Behavior Flow feature lets you see how visitors move throughout your website. You can find parts of your website that can be frustrating for users and optimize them for optimum revenue development by studying this data.
Utilize the Cohort Analysis Feature: Cohort analysis allows you to monitor the behavior of groups of users over time. You can enhance your marketing activities and stimulate revenue development by doing an analysis of this data to find trends and make data-driven decisions.
Tips and Tricks for Maximizing Your Data and Insights
It's crucial to adhere to a few best practices and suggestions to get the most out of your analytics tools and data from revenue metrics. The following advice will help you make the most of your data and insights:
Set your Objectives: Setting goals and objectives is crucial before you begin measuring revenue indicators. What do you hope to do with the data from your revenue metrics? Setting defined goals will enable you to concentrate your efforts and make sure you're monitoring the appropriate KPIs.
Use Segmentation: Segmentation is an effective strategy for understanding consumer behavior. You can better understand what drives revenue growth and pinpoint areas for improvement by segmenting your consumers based on variables like demographics, behavior, and preferences.
Monitor your Data Regularly: It's crucial to periodically check your statistics to make sure you're moving closer to your goals. You can utilize these to find trends and patterns that will help you maximize revenue growth.
Use A/B Testing: This effective strategy can be utilized to maximize revenue growth. You can determine what appeals to your audience and generates the most income by experimenting with multiple iterations of your website or marketing initiatives.
Conclusion
Measuring revenue is crucial for B2B marketing success. Businesses can obtain insights into their performance and pinpoint areas for development by measuring critical data including sales metrics, cycle time metrics, and revenue growth indicators. Businesses can make the most of their data and stimulate revenue development by utilizing analytics technologies like Adobe Analytics, Google Analytics, and GA4.
Reach out to Growth Natives at info@growthnatives.com or call +1 855-693-4769 if you require help monitoring your revenue KPIs or refining your B2B marketing tactics. To meet your company objectives, our team of professionals can help you tap into the potential of revenue metrics.